MWL Species Fit Analysis
This module inputs the time-synchronized 2DSA-IT–based ISSF simulations and performs spectral deconvolution. For each spectral interval the measured absorbance is separated by the analytes’ extinction-coefficient spectra into SSF-ISSF- datasets. The SSF-ISSF- outputs are solute-resolved, spectrum-separated datasets generated for every solute
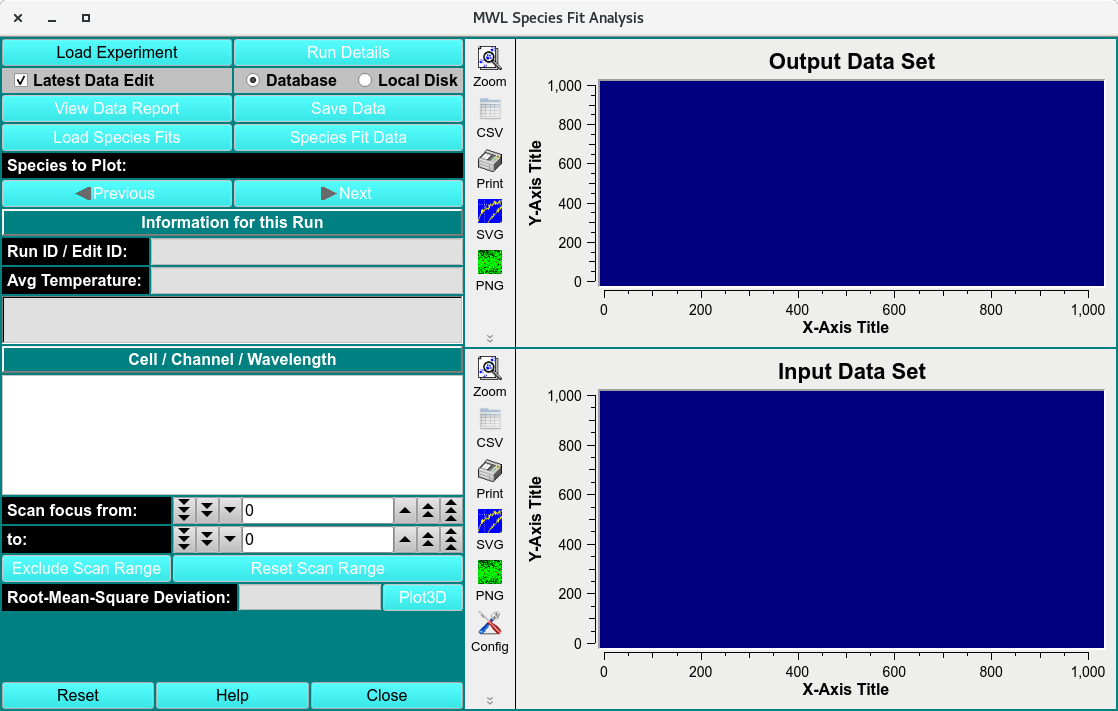
Multi-Wavelength Species Fit Analysis Main Window
MWL Species Fit Process:
Load the experiment ISSF- file using a Load Run Data Dialog.
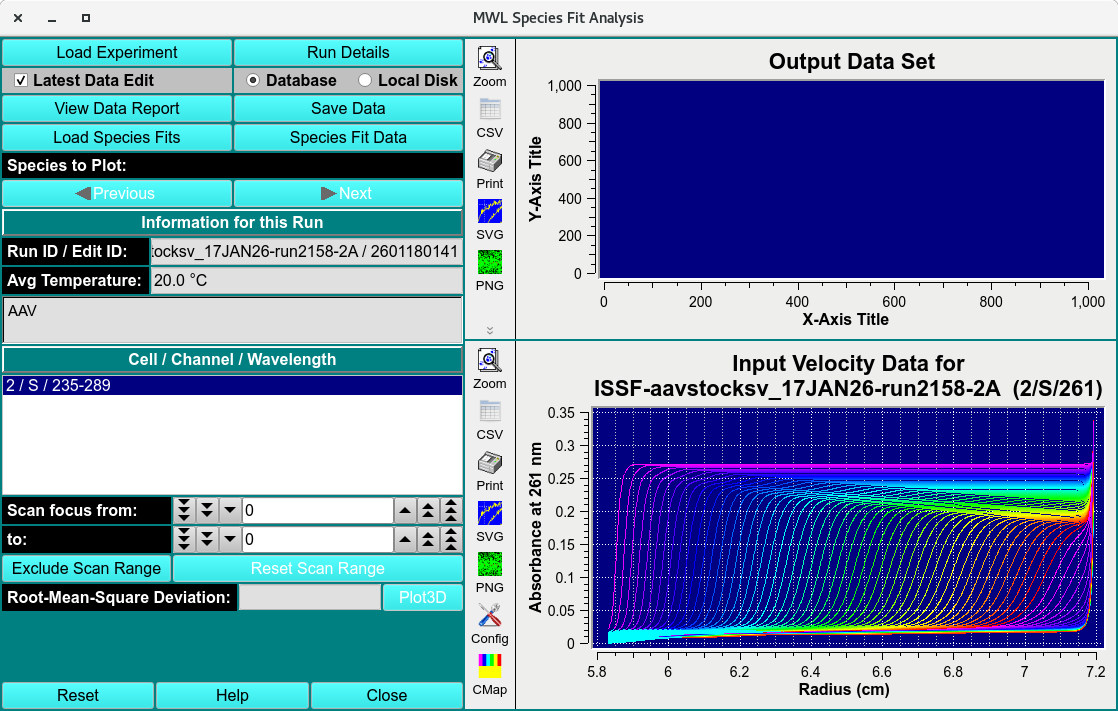
Loaded ISSF- Data
Load the extinction-coefficient spectra file as a csv. This file can be generated by measuring serial dilution spectra of analyte and fitting using Spectrum Fitter.
Click Species Fit Data and a simulation SSF-ISSF- dataset for every analyte extinction-coefficient spectra inputted will be generated and saved in the $HOME/ultrascan/imports folder.
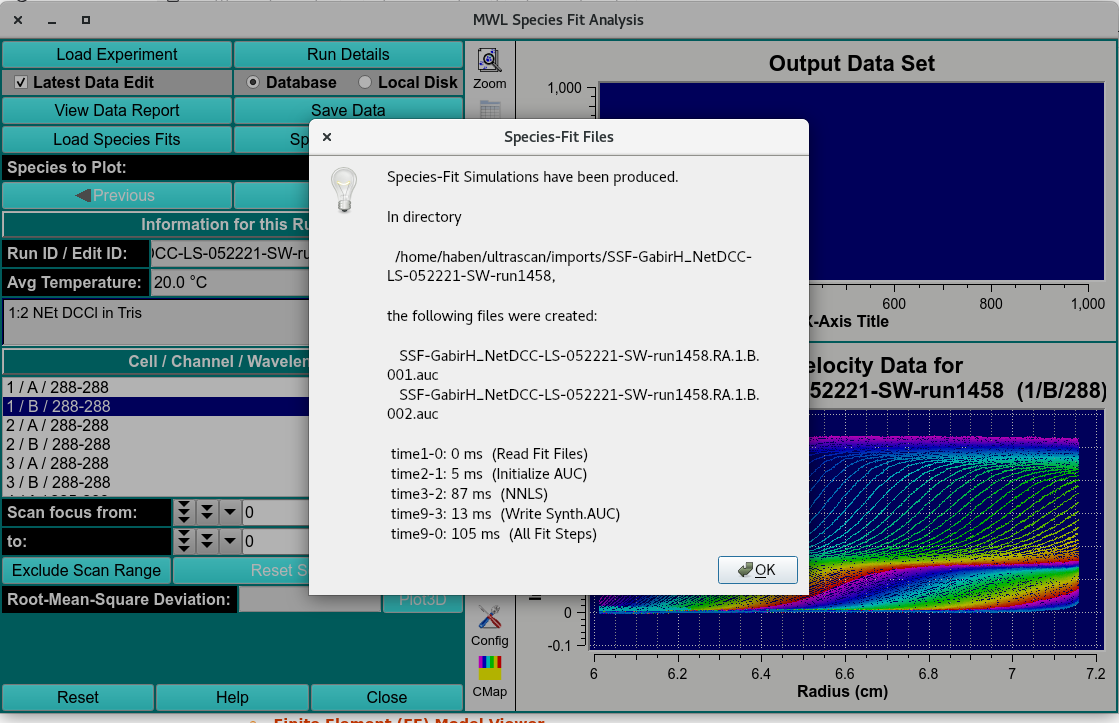
Saved Deconvoluted Data
Click Save Data and the datasets and deconvolution quality report will be saved in the database.
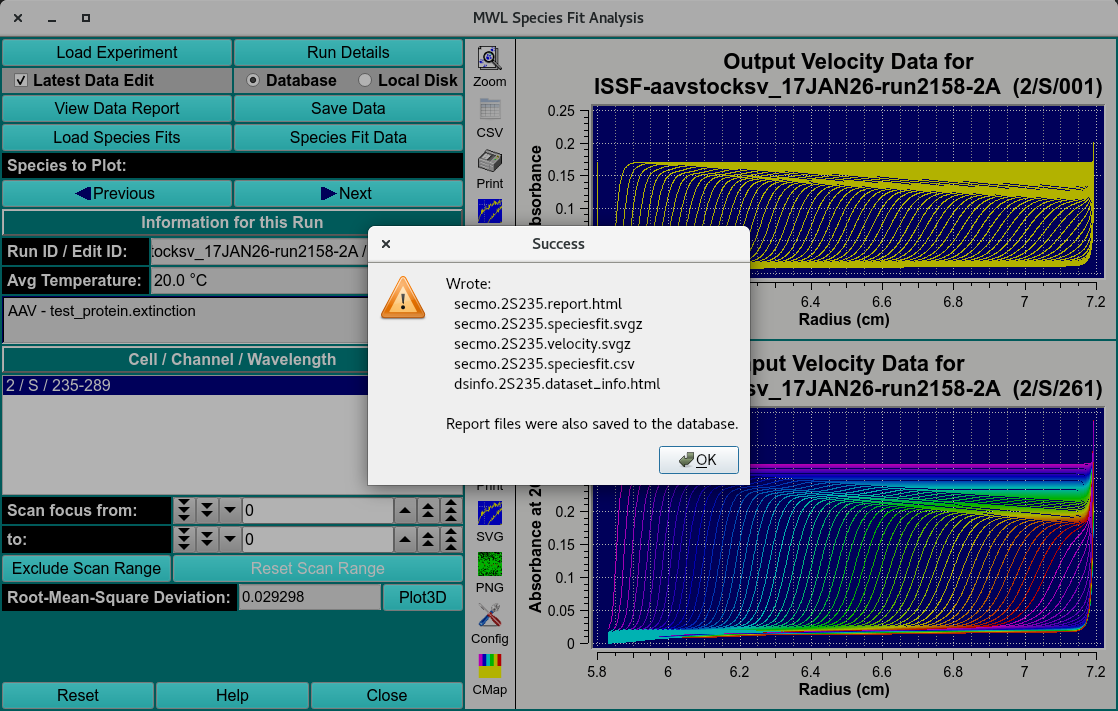
Saved Deconvoluted Data and Report
MWL Species Fit Functions:
Load Experiment |
Load the time-synchronized ISSF- simulations generated in MWL Pre-Fit Species Simulation module. |
Run Details |
Bring up a Run Details Dialog with a summary of data and run details. |
Latest Data Editor |
Select latest edit of all data displayed. |
Database |
Load or save data from the database. |
Local Disk |
Load or save data from the local disk. |
View Data Report |
View the data report file. |
Save Data |
Save the simulated data in $HOME/ultrascan/imports |
Load Species Fits |
Load the extinction-coefficient spectra files of 2 or more species from local file. Files will be saved in csv format from Spectrum Fitter |
Species Fit Data |
Generate and save SSF-ISSF- simulation files. |
Species to Plot: |
Plot one of the at least 2 species deconvoluted from the original dataset. |
Previous |
Navigate to the previous datasets. |
Next |
Navigate to the next datasets. |
Run ID/ Edit ID: |
The run and edit identification labels. |
Avg Temperature: |
Average temperature of experiment. |
Solution name: |
Name of the original solution. |
Cell / Channel / Wavelength |
Triple identifier. |
Scans focus |
Select a scan range. |
Exclude Scan range |
Exclude selected scan range. |
Reset Scan range |
Reset all excluded scans. |
Root-Mean-Square Deviation: |
The Root-Mean-Square Deviation of the deconvolution. |
Plot3D |
RMSD, residuals and fitting plots of the Deconvolution. |
Reset |
Reset window. |
Help |
Open the MWL Species Fit Analysis help documentation. |
Close |
Close window. |
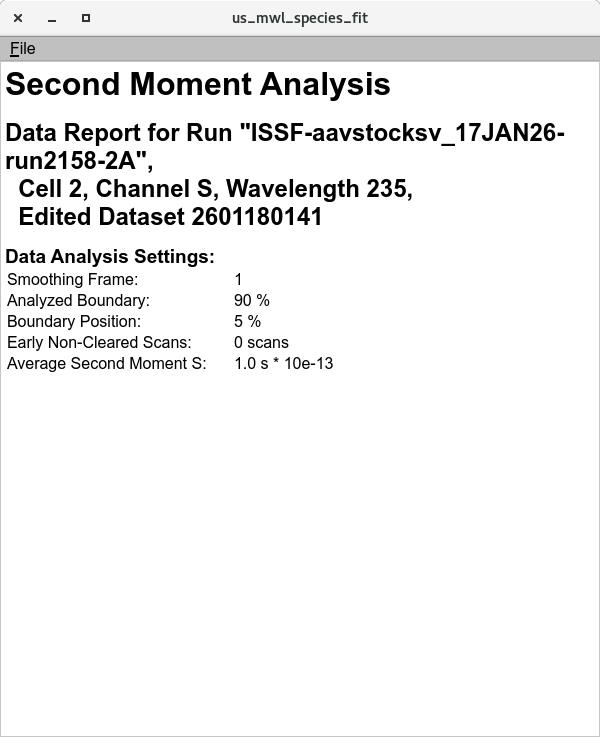
Data Report
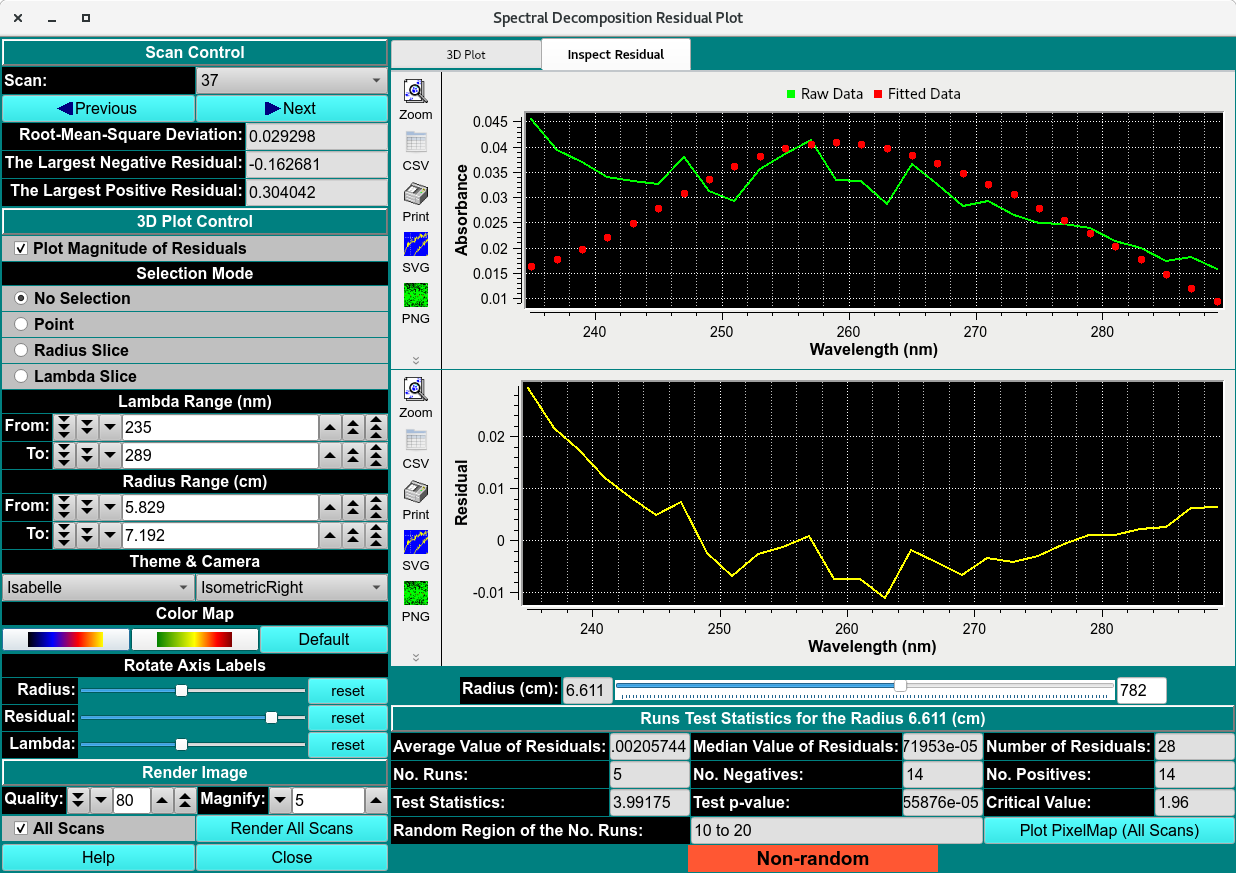
Spectral Decomposition Residual Plot
Assess the deconvolution RMSD and Residuals
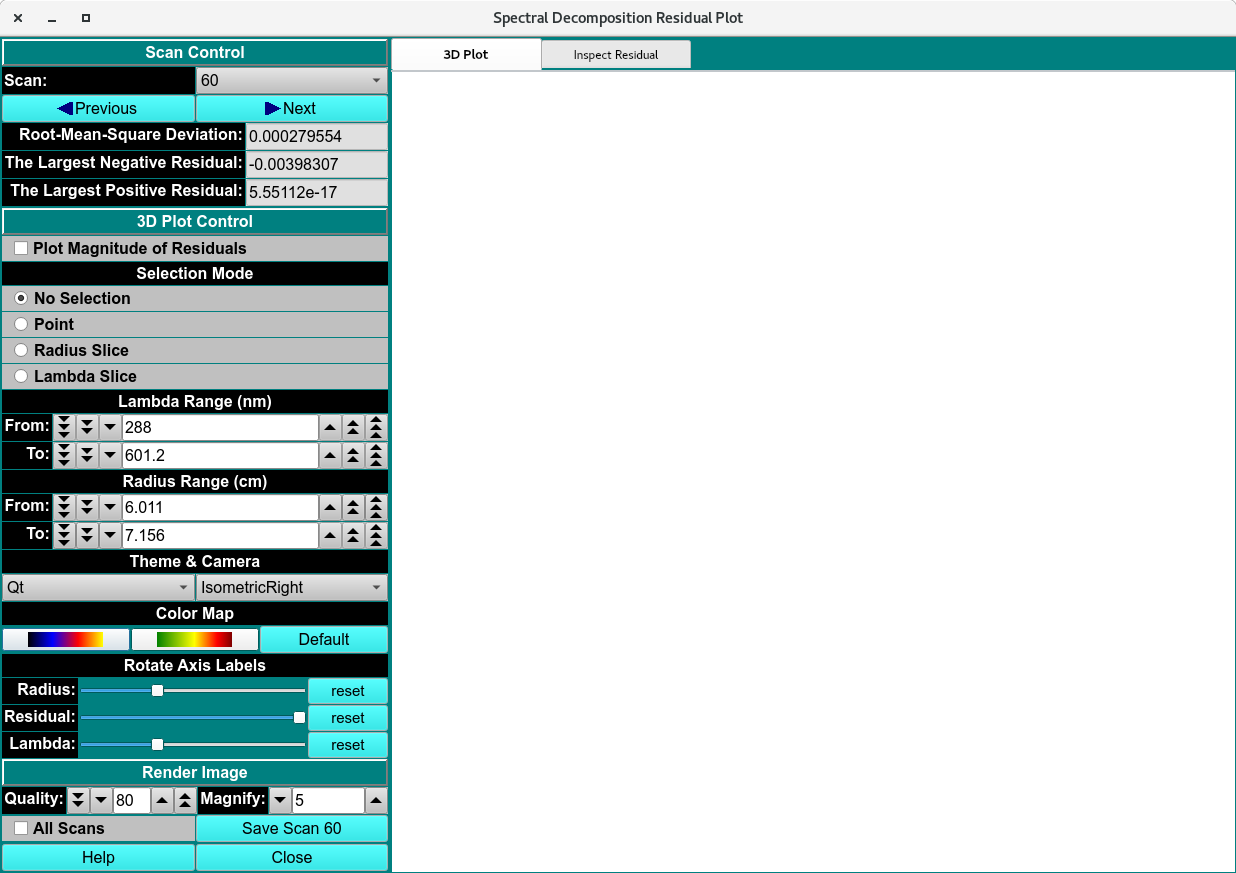
Empty Spectral Decomposition Residual Plot
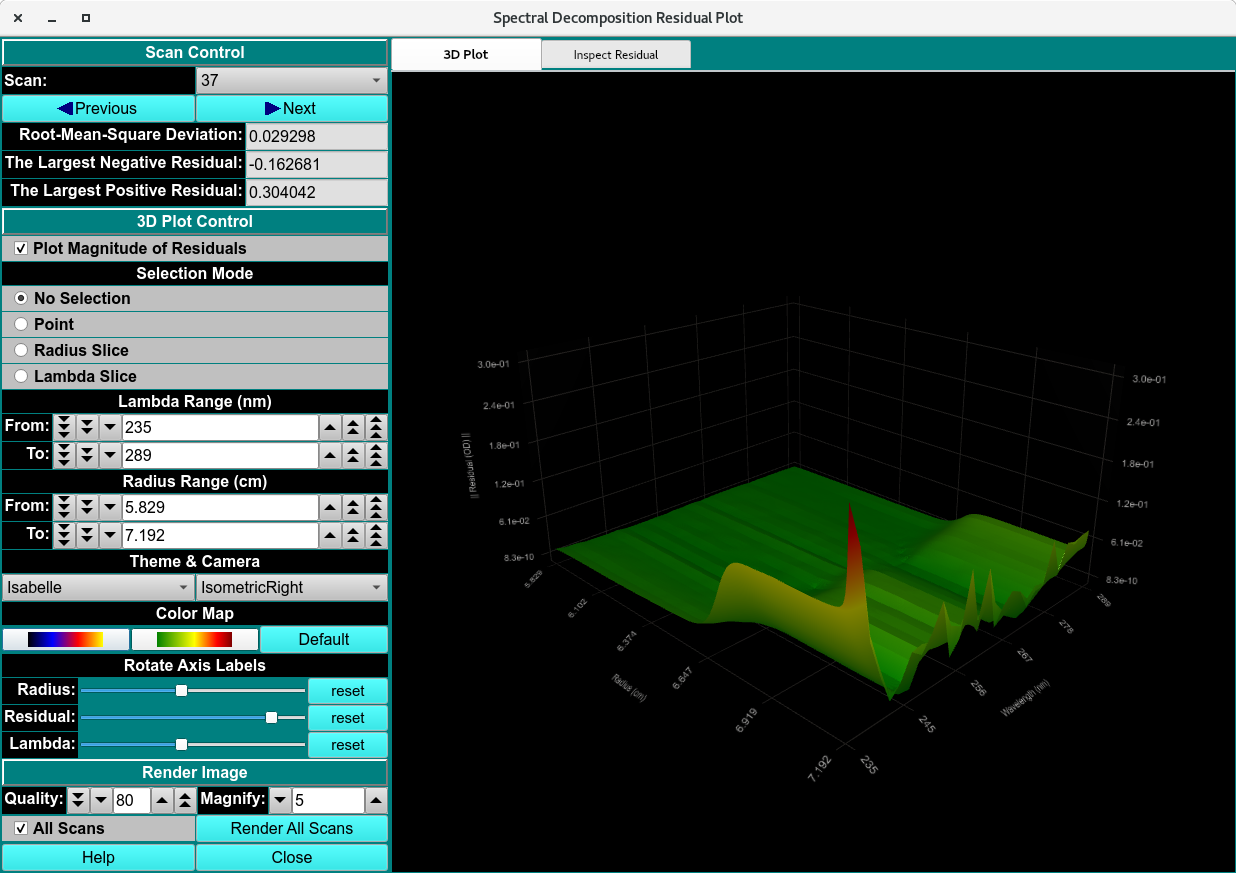
Spectral Decomposition Residual Plot
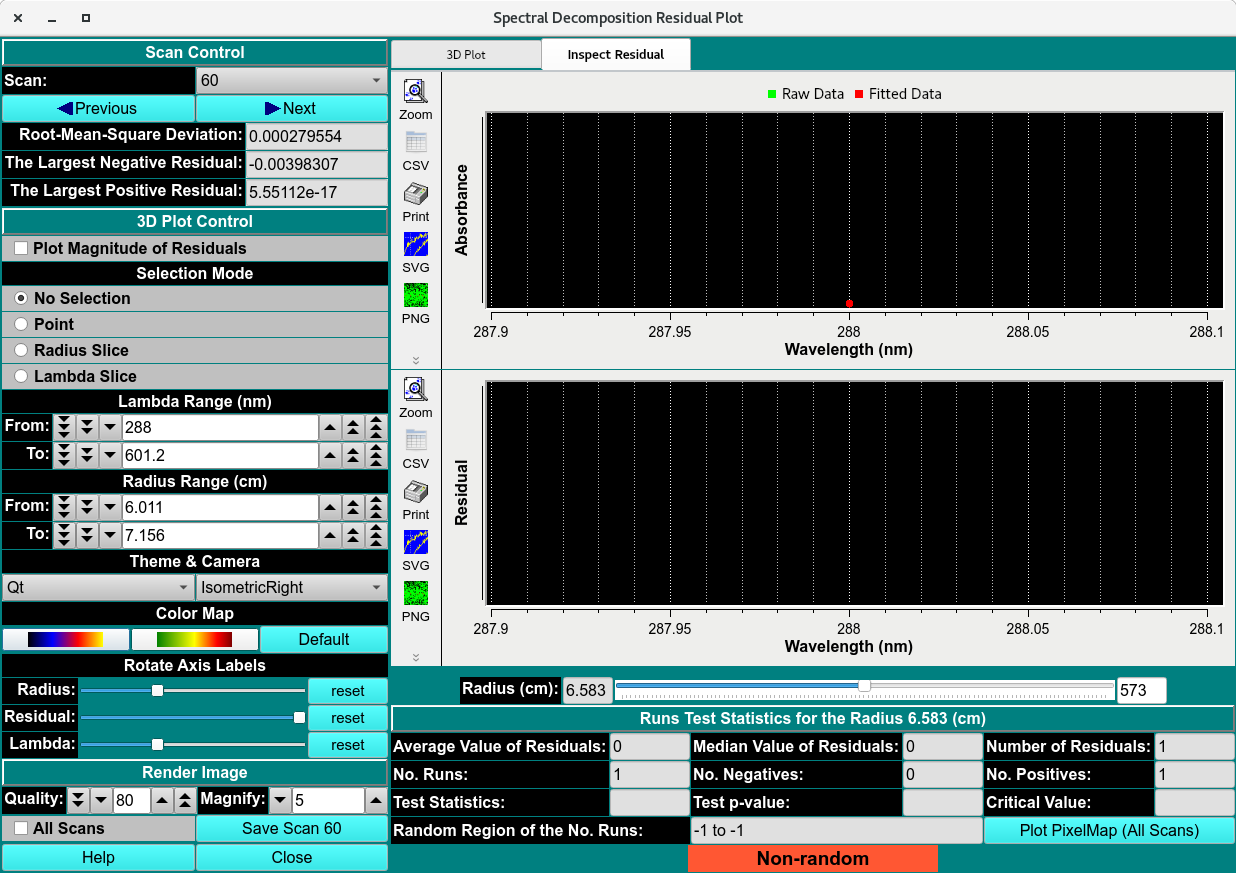
Empty Spectral Decomposition Residuals
Spectral Decomposition Residuals