Multi-Wavelength S Spectra Viewer
This module allows the user to view the multi-wavelength 2DSA models in a 2-D or 3-D plots.
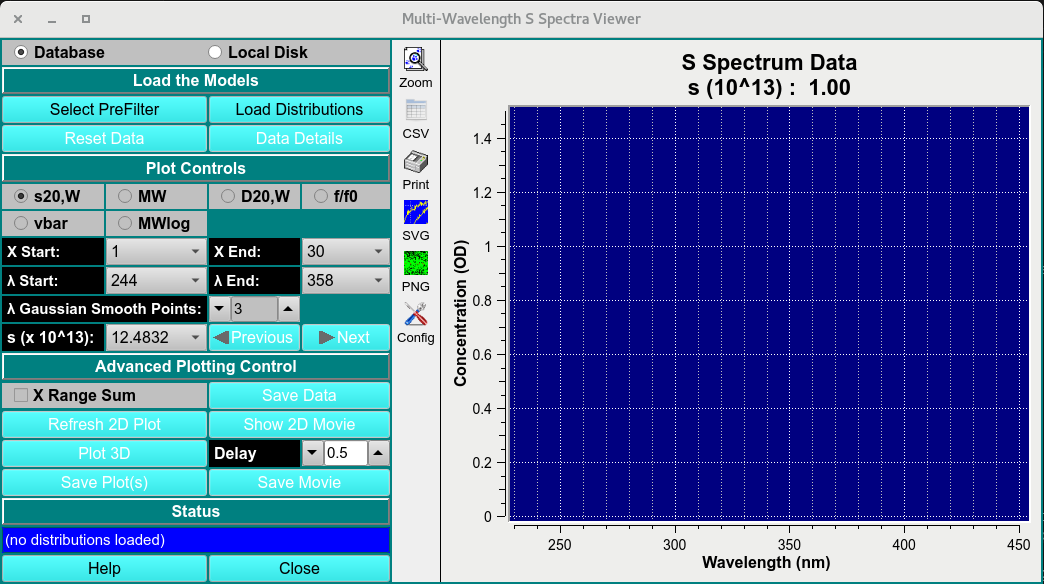
Main Window
Process:
Load MWL 2DSA-IT: Load multi-wavelength 2DSA-IT models to view by clicking on Select PreFilter then Load Distribution and select the 2DSA-IT models.
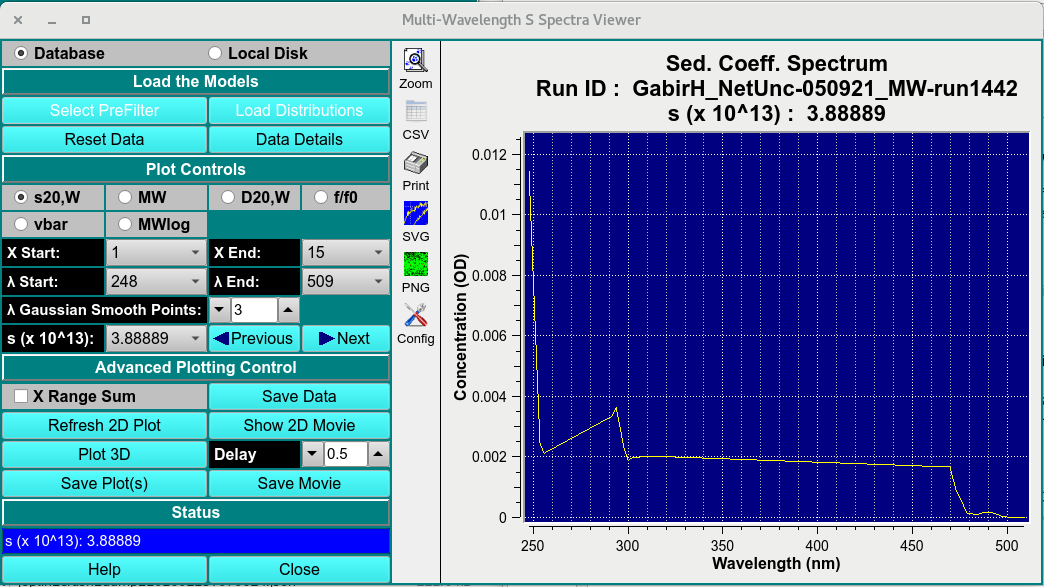
Loaded Window
Plot Controls: Set Z axis (S20,W, MW, D20,W, f/f0, vbar or MWlog) and range start (X start) and end (X End); set lambda start and end.
Advancing Plotting Control Once a 2-D plot and its ranges have been established, show a 2-D movie of all lambda/radius records to view the progression of data through record ranges.
Click on Plot 3D to bring up a control window. Within that dialog, choose scales and bring up a 3-D plot window. Continue to refine scales and orientation until the 3-D plot is as desired.
Show a 3-D Movie: Once a 3-D plot, with its scales and orientation, has been established, show a 3-D movie to see the change in data over time (scans). Note that scans may be excluded and a range of scans chosen to refine this movie.
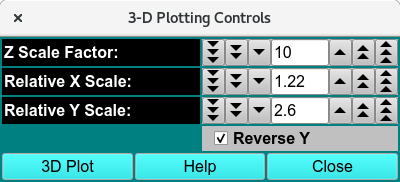
3D-Display Control
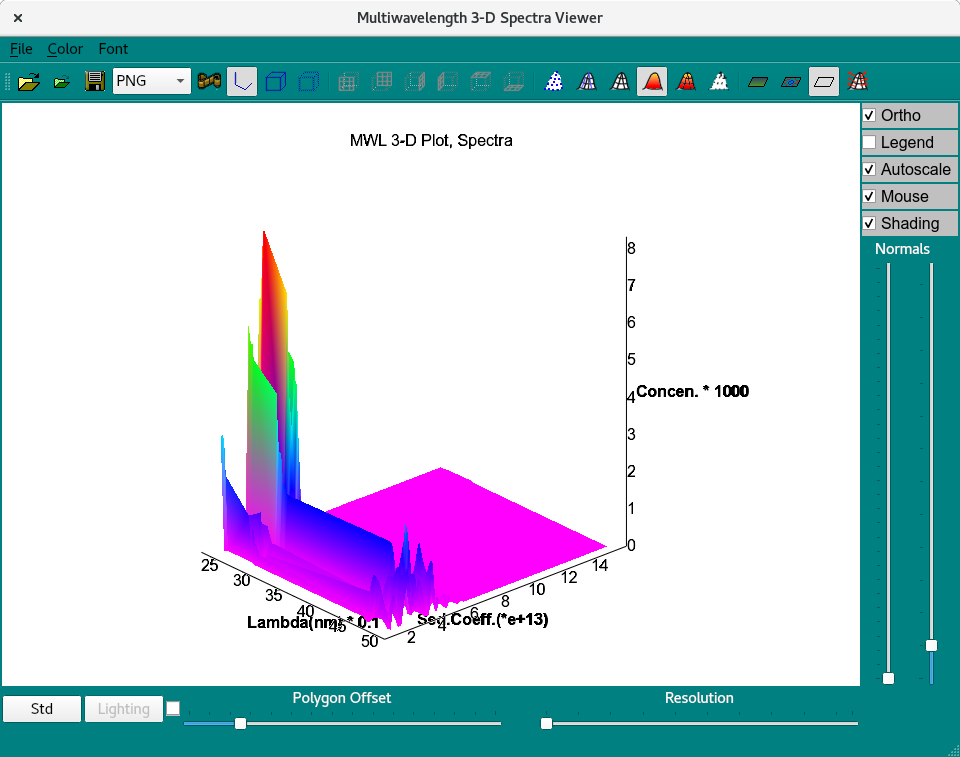
3D Viewer
Save Plots and Movies: When plots and movies are all in a desired and informative state, you may save the plots and save frame files from the movies for processing by external imaging software.
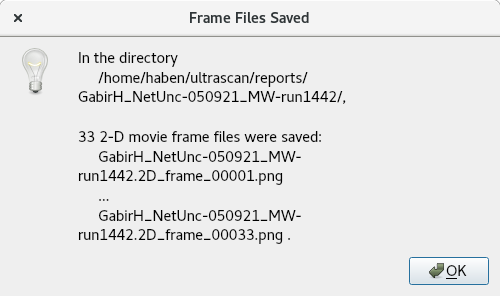
save movie as png files
MWL Spectra Viewer Functions:
Select PreFilter |
Load a run dataset as a Pre-filter using the “Select Run(s) as Models Pre-Filter (DB)”. |
Load Distribution |
Select the distributions to plot on in the Load Distribution Model(s). |
Reset Data |
Reset loaded data. |
Data Details |
Open a detailed statistical:ref:report <stats> on selected dataset. |
MWL Spectra Viewer Plot controls
X start and end |
Start and end range of selected Z axis attribute. |
λ start and end |
Start and end range of wavelength measured. |
λ gaussian smooth points: |
Gaussian smoothing function applied to each spectra at any given Z value. |
S (x10^13): |
View the wavelength attribute distribution for any S point (Z-axis). |
MWL Spectra Viewer Advanced Controls:
Save data |
Save the 2-D plot data. |
Refresh 2D plot |
Refresh plot. |
Show 2D movie |
Show spectra of each S value. |
Plot 3D |
Plot the 3-D graph with X as wavelength, Z as user selected attribute, and Y as signal intensity. |
Delay |
Frame delay between frames. |
Save plots |
Save plots to $HOME/ultrascan/reports. |
Save movie |
Save movie to $HOME/ultrascan/reports. |
Status box |
Update status box. |
Help |
Help documentation to this module. |
Close |
close window. |
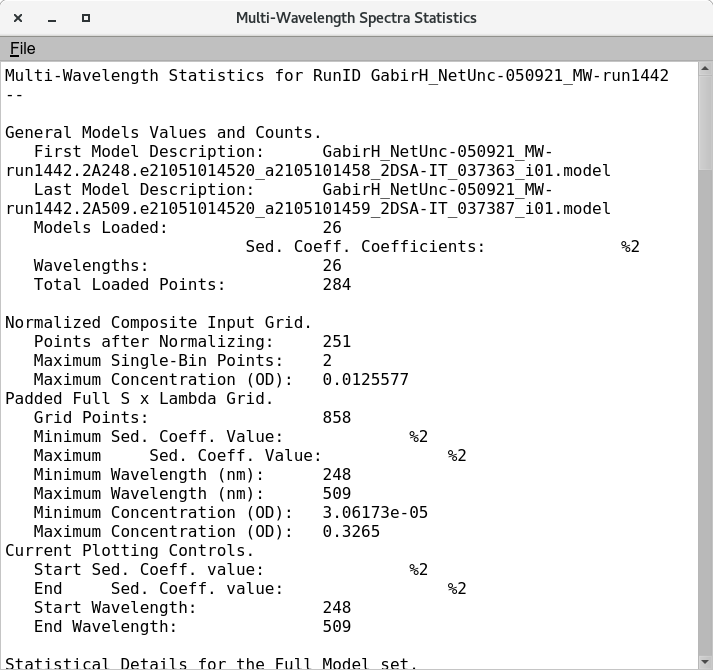
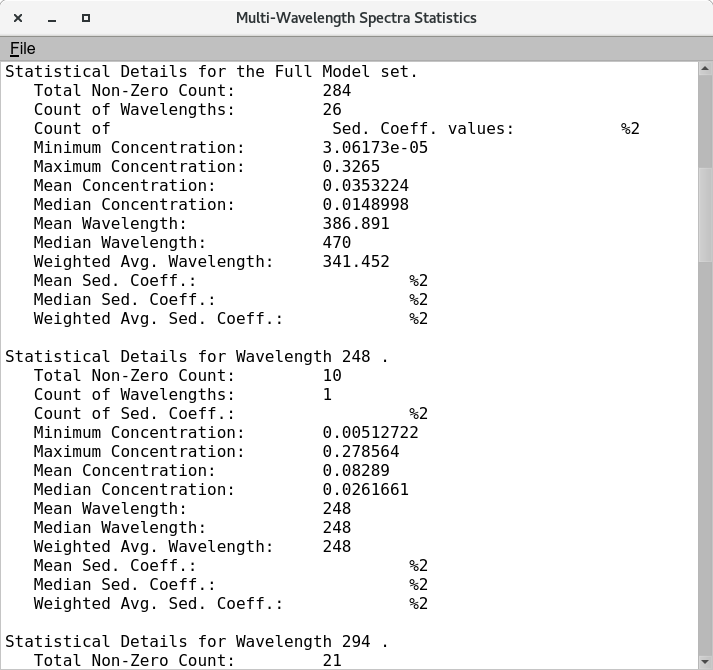
Statistical Details of loaded multi-wavelength dataset