Buoyancy Equilibrium Data Analysis
Caution
This module is designed to determine the density and partial specific volume of peak positions in a gradient forming solution at equilibrium, for example, in analytical buoyant density gradient experiments (ABDE) experiments. The model’s original numerical calculation does not take into account certain non-ideality conditions encountered in CsCl, a topic that is currently under investigation. Until an update is available, the density results obtained in CsCl gradients could be inaccurate.

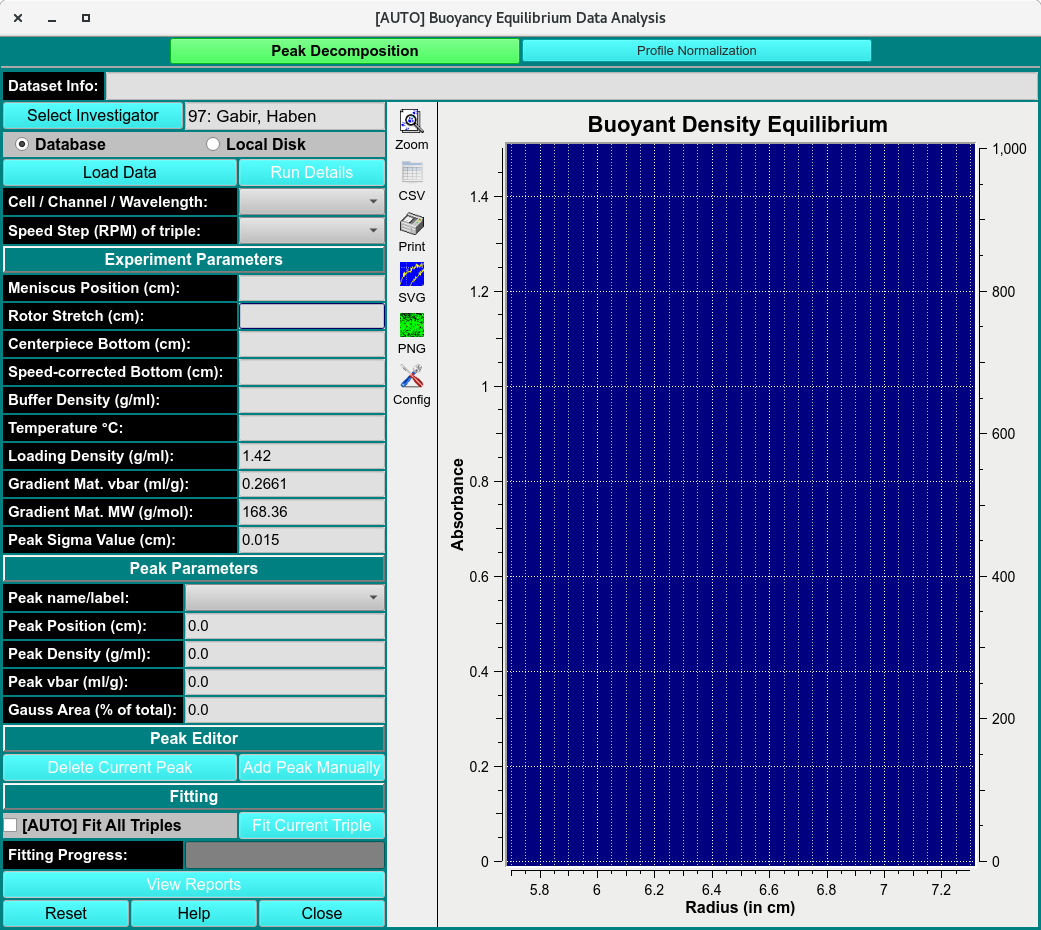
ABDE Analysis Main Window
Peak Decomposition
Spectrum Fitter
Spectrum Fitter
Peak Decom. Functions:
Dataset Info: |
Displays information about the currently selected dataset used for buoyancy equilibrium analysis. |
Database |
Selects data from the database as the source for analysis. |
Local Disk |
Selects data files stored on the local computer. |
Load Data |
Loads the selected dataset into the Peak Decomposition window. |
Run Details |
Displays details for the loaded run, including experiment and scan information. |
Cell /Channel/ Wavelength: |
Shows the selected cell, channel, and wavelength for the current dataset. |
Speed Step (RPM) of Triple: |
Displays the rotor speed step associated with the selected triple. |
Experimental Parameters
Meniscus Position (cm): |
Displays or sets the radial position of the meniscus in centimeters. |
Rotor Stretch (cm): |
Displays the rotor stretch correction applied to the measurement. |
Centerpiece Bottom (cm): |
Displays the radial position of the centerpiece bottom. |
Speed-corrected Bottom (cm): |
Displays the bottom position corrected for rotor speed effects. |
Buffer Density (g/ml): |
Specifies the density of the buffer solution. |
Temperature °C: |
Displays or sets the experimental temperature in degrees Celsius. |
Loading Density (g/ml): |
Specifies the density of the loaded sample. |
Gradient Mat. vbar (ml/g): |
Displays or sets the partial specific volume of the gradient material. |
Gradient Mat. MW (g/mol): |
Displays or sets the molecular weight of the gradient material. |
Peak Sigma Value (cm): |
Specifies the Gaussian peak width used during decomposition. |
Peak Parameters
Peak name/label |
Displays the name or identifier assigned to the selected peak. |
Peak Position (cm): |
Displays or sets the radial position of the selected peak. |
Peak Density (g/ml): |
Displays the density corresponding to the selected peak position. |
Peak vbar (ml/g): |
Displays the partial specific volume associated with the selected peak. |
Gauss area (1% of total): |
Displays the Gaussian peak area as a percentage of the total signal. |
Peak Editor
Delete Current Peak |
Removes the currently selected peak from the decomposition model. |
Add Peak Manually |
Adds a new peak manually to the model for fitting and analysis. |
Peak Fitting
Fit All Triples |
Fits all available triples in the dataset using the current peak decomposition settings. |
Fit Current Triples |
Fits only the currently selected triple. |
Fitting Progress: |
Displays the progress of the fitting operation. |
View Reports |
Opens reports summarizing the peak fitting results. |
Reset |
Resets the current fitting parameters and results. |
Help |
Opens the help documentation for the Peak Decomposition window. |
Close |
Closes the Peak Decomposition window. |
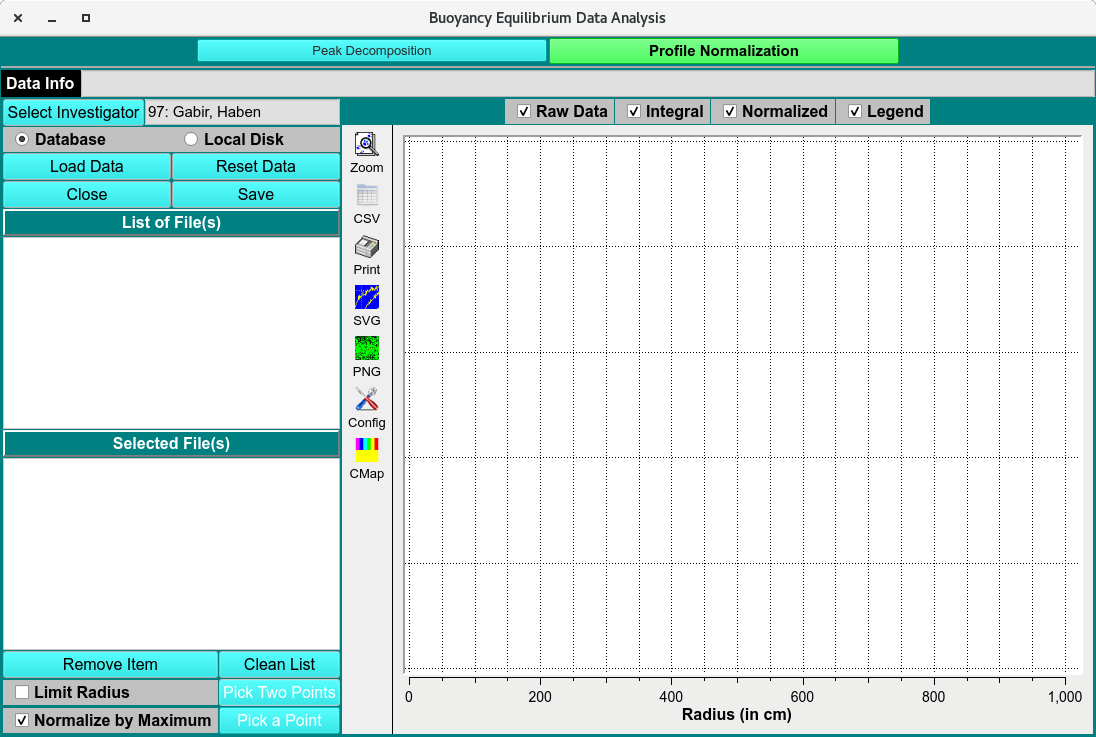
Profile Normalization
Spectrum Fitter
Profile Norma. Functions:
Load Data |
Loads one or more files for profile normalization. |
Reset Data |
Clears the current normalization results and restores the original data. |
Close |
Closes the Profile Normalization window. |
Save |
Saves the normalized profile data. |
List of File(s) |
Displays the available files selected for normalization. |
Selected File(s) |
Shows the file or files currently chosen for processing. |
Remove Item |
Removes the selected file from the processing list. |
Clean List |
Clears all files from the current list. |
Limit radius |
Restricts the normalization range to a selected radial interval. |
Pick Two Points |
Allows selection of two points to define the normalization or integration range. |
Normalize by Maximum |
Normalizes each profile using its maximum signal value. |
Pick a Points |
Allows selection of a reference point for normalization. |
Plots
Raw Data |
Displays the original unprocessed data profiles. |
Integral |
Displays the integrated signal across the selected radial range. |
Normalized |
Displays the normalized data profiles. |
Legend |
Shows or hides the plot legend identifying the displayed datasets. |